Introduction
Oxfordshire County Council (OCC) carries out an annual update to housing-led population forecasts to support planning for school places, social care and other services. These differ from the population projections provided by ONS in that they:
- provide estimates of population change at a small area level (Middle Layer Super Output Areas, 87 in Oxfordshire).
- take into account the predicted increase in housing across Oxfordshire from planned district housing trajectories as of January 2024.
It is important to note that the rate of housebuilding is an input to the model and the outputs reflect the expected population if that level of housebuilding takes place. The forecasts, therefore, are not indicative of housing need, and should not be used or interpreted as such.
What the forecasts show
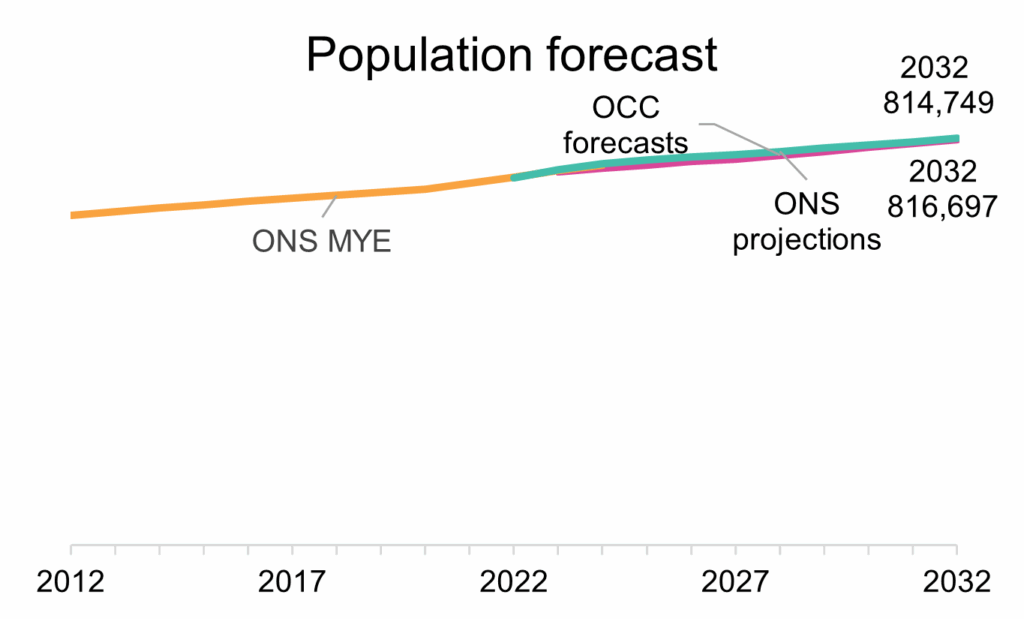
The August 2025 update of the Oxfordshire County Council housing-led forecasts predict a total population in Oxfordshire of 814,700 by 2032, a growth of 64,500 (+9%) since 2023. Over the same period the ONS population projections show an increase of +8% but the ONS Mid-year estimates (MYE) between 2014 to 2023 saw a +11% increase.
Age groups
| OCC forecasts | ONS projections | |||||
| Age band | 2023 | 2032 | Percentage change | 2023 | 2032 | Percentage change |
| Under 18s | 152,500 | 151,000 | -1% | 151,100 | 147,300 | -3% |
| Working age (18-64) | 460,700 | 498,500 | +8% | 465,300 | 497,800 | +7% |
| Older people (65+) | 137,100 | 165,300 | +21% | 137,100 | 171,700 | +25% |
| All ages | 750,200 | 814,700 | +9% | 753,460 | 816,697 | +8% |
- Under 18s show an increase then decrease. The peak is in 2025 for Oxfordshire County Council forecasts and 2024 for the ONS projections. the 2032 population are lower than the 2023 population
- Working age people aged 18 to 64 increase over the time period. The ONS projections having a more rapid increase earlier then slowing down, while the OCC forecasts increase is more linier.
- Older people show the largest percentage increase of over 20%. OCC forecasts are lower than the ONS projections.
District level data
Cherwell
Cherwell remains the largest district with an population increase from 166,300 in 2023 to 184,000 in 2032 (+17,600 +11%) in the OCC forecasts, which is inline with the ONS projections of a 11% increase as well. for under 18 the population is stable at about 36,000. working age population is going to increase by 10% from 101,000 to 111,000. Older people are looking to increase from 29,600 to between 36,800 (OCC) or 37,900 (ONS). the growth is mainly driven by increase housing in all areas but include the aging population and lower births.
Oxford
Oxford population is to increase by 5,500 (+3%) from 165,200 to 170,700. The ONS projections show little growth, this is mainly due to the ONS being higher in 2023 due to not reflecting the drop in population due to international migration. The under 18s are showing a drop in population of 11% (3,200 children) but increase of 5% (5,500) for working age and 16% (3,200) older people. The drop in children is mainly due to policy changes in international migration dependents.
South Oxfordshire
South Oxfordshire Population is to increase by about 11% (16,700) from 153,400 in 2023 to 170,100 in 2032. This changes is 800 children under 18 (3% increase), 9,300 working age (10%) and 6,600 older people (21%). The ONS projection is a little lower increase at 9% (14,200)
Vale of White Horse
Vale of White Horse is district with the largest population increase at 20,600 or 14% from 146,000 to 166,600. The latest ONS projections show an increase of 12% (18,160). The 20,600 people include 2,100 extra children (7% increase ), 13,000 of working age (15%) or 5,500 over 65s (19%).
West Oxfordshire
West Oxfordshire is showing the smallest growth at only 4,000 people (3%) between 2023 119,300 and 123,400 in 2032. This change made up of a reduction of 1,900 children (8%) and in increase of 5,600 older people (21%). Working age has small increase of 300 people. ONS projections show a increase of 9,800 (8%). There is a difference in the West Oxfordshire between the two projections due to the differences in new housing predictions as ONS are using the last 5 years new housing additions projected forward while the OCC forecasts use the West Oxfordshire District Council’s Local plan planning policy.
Resources
Explore the forecasts using our interactive dashboard and download the excel data pack with forecasts for districts (single year of age) and MSOAs (5 year age bands)
Link to the latest ONS 2022-based population projections and Mid-year estimates
If you have questions, please use our contact form