
Oxfordshire’s 2024 Emissions Data
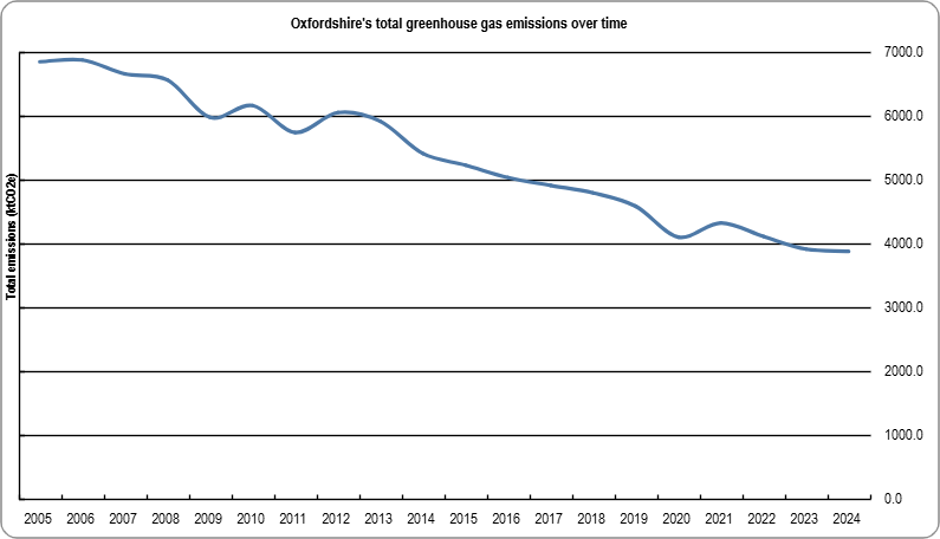
Oxfordshire’s annual greenhouse gas emissions data provides a snapshot of the county’s contribution to climate change. Greenhouse gases, such as carbon dioxide and methane, trap heat in the atmosphere. Human activities are increasing these gases, causing the planet to warm and our climate to change. The latest figures relate to 2024, as local emissions data is released by the Department for Energy Security and Net Zero (DESNZ) two years after each reporting year. They show that emissions continue to trend downwards overall, but they also reveal a more complex picture about where those reductions are coming from and where the biggest challenges remain.
Many of the reductions achieved over the last 15 years have come from cleaner electricity, more efficient buildings, and decarbonisation of industry. As we make progress in these areas, the sources of emissions which are harder to decarbonise, such as transport, make up a greater proportion of our total emissions.
Additionally, reducing emissions is only one side of the climate challenge. Oxfordshire is already experiencing the effects of a changing climate through hotter summers, more frequent heatwaves and increased flood risk. The speed at which we can reduce our emissions will influence the scale of these future impacts on residents and businesses and the extent to which communities will need to adapt.
Why emissions are getting harder to reduce
Oxfordshire has reduced emissions substantially since 2008. However, the composition of those emissions has changed.
Early reductions came from significant national changes, such as the decarbonisation of the UK electricity grid. This means that homes and businesses now generate fewer emissions even when using similar amounts of electricity. Improvements in energy efficiency and industrial processes have also contributed to reductions.
The sectors that remain are more difficult to decarbonise.
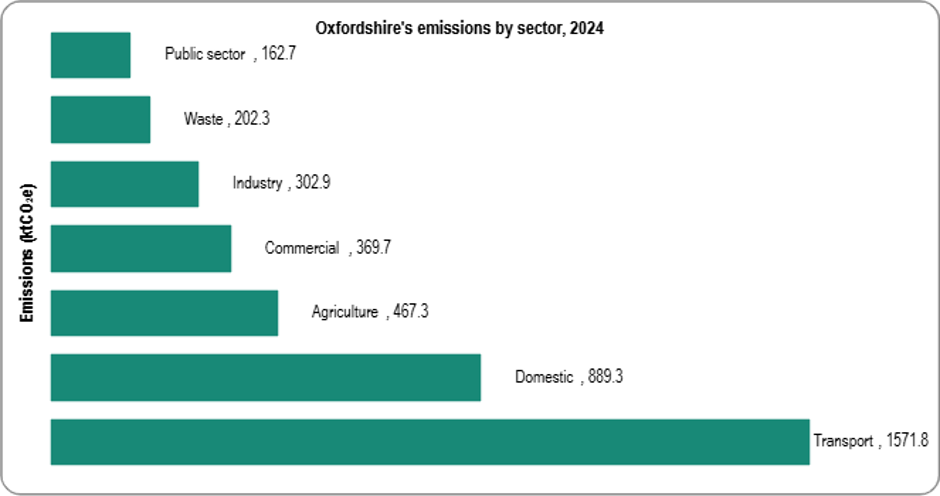
Transport relies heavily on infrastructure, technology, and behaviour changes that can take time to deliver. Domestic emissions are closely tied to the fuel we use to heat and cook in our homes, particularly the continued use of gas. Agricultural emissions arise from biological processes associated with food production and land management, making them harder to eliminate entirely.
As a result, future progress is likely to depend more on addressing these complex, system-wide challenges.
Transport: Oxfordshire’s biggest climate challenge
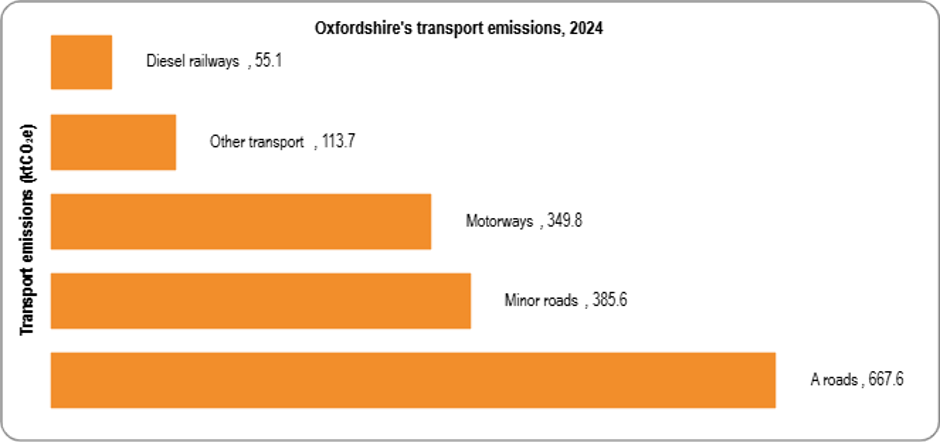
Transport remains the single largest source of greenhouse gas emissions in Oxfordshire, responsible for around two-fifths, or 40 per cent, of the county’s total emissions.
Oxfordshire is the most rural county in the South East, with many communities spread across a large geographical area and without easy access to public transport. They rely on cars to access jobs, education, healthcare, and other services.
The county is also home to major strategic transport routes such as the M40, A40 and A34, which serve regional and national traffic passing through the county. This means a significant share of our transport emissions are due to trips that pass through the county, including large volumes of freight.
Future reductions depend on changes to how people and goods move around, whether through zero emission vehicles, improved access to high quality public transport and active travel routes, or reducing the need to travel in the first place.
We know that this will be challenging. Cars, vans, and HGVs are deeply ingrained in modern society. They are often associated with independence, convenience, and social and cultural norms. Many of our towns, cities and communities have been designed around driving, making car travel the easiest and most practical option for many journeys. At the same time, not everyone is able to use public transport or travel by walking, wheeling, or cycling due to factors such as disability, age, health conditions, caring responsibilities, cost, safety concerns, or access. This means reducing transport emissions involves addressing infrastructure, planning, and travel habits, while ensuring people can continue to access the jobs, services, and opportunities they rely on.
This in turn affects more than just climate. Traffic congestion, fuel costs, air pollution, road safety, and access to jobs and services are all closely linked to how people travel. Decisions about transport therefore have implications not only for Oxfordshire’s carbon footprint, but also for residents’ daily lives and household costs.

What the district data tells us
The district-level figures highlight how geography shapes emissions.
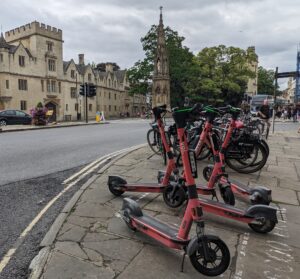
Oxford City has the lowest emissions per person in the county. In terms of transport, this is influenced by its compact urban form, shorter travel distances, and lower levels of car dependency compared with more rural areas. Demographic factors also come into play, such as the large student population and areas of deprivation where factors such as lower disposable incomes and shared living can result in lower levels of consumption and associated emissions. This is further supported by the city’s limited agricultural and industrial activity, meaning fewer emissions are generated from these sectors.
By contrast, districts such as Cherwell, South Oxfordshire, and Vale of White Horse record higher emissions associated with transport and, in some cases, agricultural activity. This demonstrates how factors such as settlement patterns, transport infrastructure, and land use influence emissions.
This is important because it suggests that different parts of Oxfordshire may require different approaches to reducing emissions. Solutions that work in a dense urban environment are not always appropriate in rural communities, and vice versa.
Carbon budgets: the measure that really matters
While annual emissions figures attract most attention, carbon budgets arguably provide a more important measure of progress.
A carbon budget sets a limit on the total amount of greenhouse gases that can be emitted over a given period while remaining on a pathway towards net zero. In effect, it asks not only whether emissions are falling, but whether they are falling quickly enough.
This distinction matters. Emissions can continue to decrease while still exceeding the level required to reach long-term climate targets.
The latest data shows that Oxfordshire’s emissions remain substantially lower than in 2008. However, the county’s carbon budgets, outlined in the Pathways to Zero Carbon Oxfordshire (PaZCO) Net Zero Route Map and Action Plan, illustrate the scale of reductions still required over the coming years. The challenge is not simply continuing the current trend, but accelerating it sufficiently to stay within the emissions limits associated with a net zero future.
For residents, carbon budgets provide an indication of whether Oxfordshire is on track to meet its long-term climate commitments. While annual emissions can fluctuate from year to year, carbon budgets reveal whether progress is happening quickly enough to avoid storing up larger and potentially more costly challenges for the future.
Oxfordshire’s emissions have fallen substantially over the longer term, including by around 20% since 2018. The 2024 reduction was on target at 1%, and in the same year the county was at 19% of the 5-year 20% allocation, meaning we are just on budget, with one year remaining in the 5-year budget. This follows a sharp decline in emissions during COVID, quick recovery in emissions in 2021, and a subsequent steady decline since.
How Oxfordshire County Council is helping
Oxfordshire County Council is working across many of the areas highlighted by the data, recognising that there is no single solution to cutting emissions. This includes supporting communities to take local climate action through the Community Action Group and Climate Action Oxfordshire networks; helping homes become more energy efficient and lower carbon through retrofit programmes; developing clean energy systems; and making lower-carbon travel easier through investment in walking, wheeling, cycling, and public transport. In Oxford for example, the ZEBRA programme has helped introduce 159 electric buses, cutting emissions while providing cleaner public transport. The council also works with businesses, local authorities, and other organisations through partnerships such as Zero Carbon Oxfordshire to coordinate action and tackle challenges that cannot be addressed by one organisation alone.
So what does this mean for Oxfordshire?
The 2024 figures tell two stories at the same time.
The first is that Oxfordshire today emits significantly less greenhouse gas than it did in 2008. That reflects real changes across the energy system, buildings, businesses, and communities.
The second is that the remaining emissions are increasingly concentrated in sectors that are difficult to tackle. Transport, domestic heating and agriculture now account for a large proportion of the county’s emissions, and each presents challenges that cannot be solved through a single policy or technology.
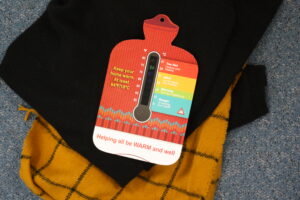
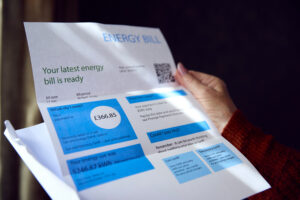
In the domestic sector, the continued reliance on gas heating is significant not only because of its impact on emissions, but because it leaves many households exposed to volatile energy prices. Improvements to energy efficiency and cleaner heating technologies can help reduce both emissions and energy bills over time.
The data therefore suggests that the question facing Oxfordshire is how to reduce emissions from the specific sectors that are proving hardest to change. Building on the progress already made through cleaner electricity generation, further reductions will require action across areas such as transport, buildings and infrastructure. While these changes can be complex to deliver, they also have the potential to bring wider benefits to everyday life.
The data is not just about tonnes of carbon. It is about how Oxfordshire heats its homes, powers its businesses, moves people and goods around the county, and prepares for a changing climate. The choices made by local authorities, organisations, communities, and individuals over the coming years will help shape not only the county’s emissions trajectory, but also the places people live, work, and travel in every day.
Sources:
UK local authority and regional greenhouse gas emissions statistics, 2005 to 2024
2005 to 2024 UK local and regional greenhouse gas emissions – data tables (Excel)