The Census 2021 was the first time that the sexual orientation question was asked, on a voluntary basis for those aged 16 and above. People were asked “Which of the following best describes your sexual orientation?”. The options were:
- Straight or heterosexual
- Gay or lesbian
- Bisexual
- All other sexual orientation
The selection “other” included a free text box for respondents to write in sexual orientation.
Additional information can be found on the ONS sexual orientation page and Oxfordshire data explorer’s sexual orientation section.
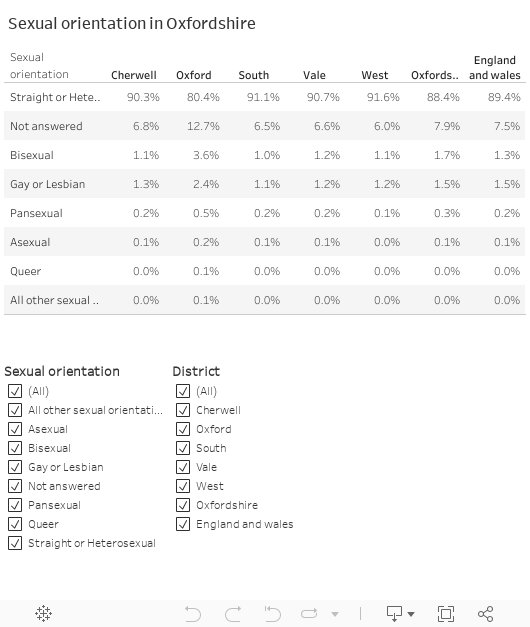
Sexual orientation in Oxfordshire
88.4% of the county identify as straight or heterosexual (526,306), this percentage was lower than the nation average of (89.4%). 3.4% of the county did not identify as straight or heterosexual (21,428). The remaining 7.9% (47,299) of the county did not answer the question.
The Census 2021 tells us of our residents who did not describe themselves as straight or heterosexual:
| Sexual orientation | People | Percentage of population |
|---|---|---|
| Bisexual | 10,009 | 1.68% |
| Gay or lesbian | 8,828 | 1.48% |
| Pansexual | 1,601 | 0.27% |
| Asexual | 547 | 0.09% |
| Queer | 287 | 0.05% |
| All other sexual orientations | 156 | 0.03% |
LGBTQI+ orientations across the county
Looking at the proportion of LGBTQI+ orientations by district, Oxford had the largest proportion, and West Oxfordshire had the lowest:
By district
Census table TS079