Introduction
The English indices of deprivation 2025 were published on 30 October 2025 by the Ministry of Housing, Communities and Local Government. The 7 standalone indexes combine together to for the Index of Multiple Deprivation (IMD). The dataset provides statistics on relative levels of deprivation in England. In this article, we summarise the data relevant to Oxfordshire.
Information on the methodology of the full dataset can be found on the gov.uk website.
The published data is shown by Lower-layer Super Output Areas (LSOAs) in England. These are small areas designed to be of a similar population size, with an average of approximately 1,500 residents or 650 households. There are 33,755 LSOAs in England and in Oxfordshire we have 428. Multiple LSOAs can be aggregated to indicate deprivation for Middle-layer Super Output Areas (MSOAs). The ONS have created a best-fit lookup for LSOAs to electoral wards so we can give an indication of deprivation at this geography level also. Data was also published at upper-tier local authority (county) level and lower-tier(district) level meaning we have data for Oxfordshire and the district/city areas.
A full deprivation map can be found in the gov.uk deprivation map viewer: Local Deprivation Explorer – Home
We have a map that shows area boundaries in Oxfordshire. This does not include the IMD data.
Lower-layer Super Output Areas (LSOAs)
Overview
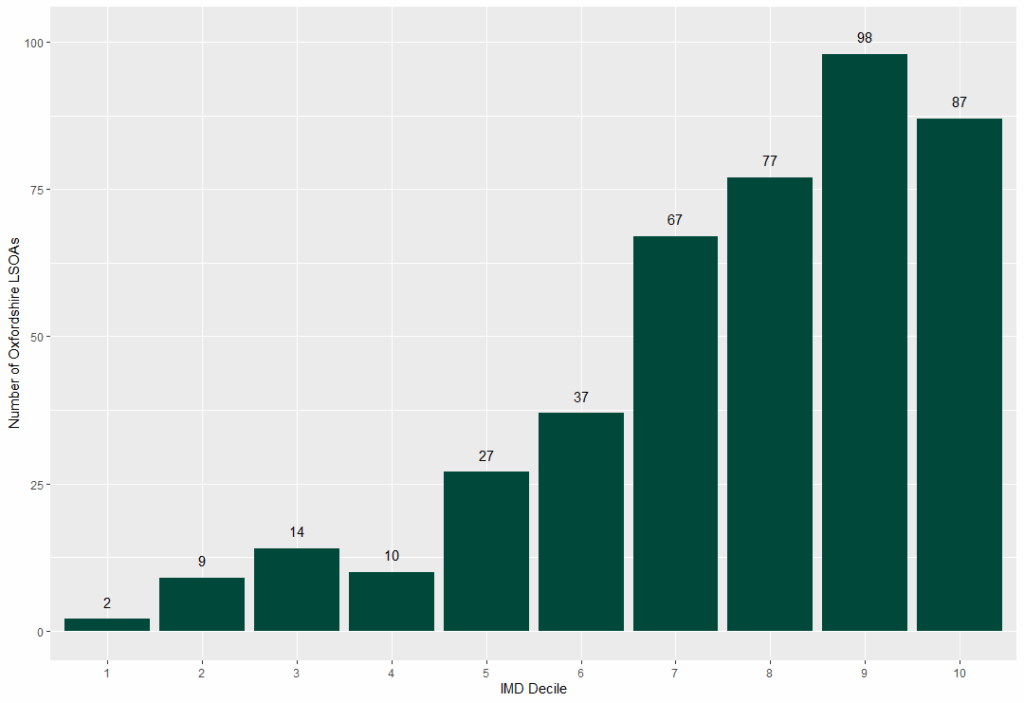
In 2025, there are 428 LSOAs in Oxfordshire. Of these, 2 LSOAs are in the most deprived decile in England: Oxford 018B and Oxford 018C. There are 9 LSOAs in the second most deprived decile:
| LSOA Code | LSOA Name | Parent MSOA name | IMD Rank | IMD Decile |
| E01028568 | Oxford 018B | Greater Leys | 3138 | 1 |
| E01028569 | Oxford 018C | Greater Leys | 3150 | 1 |
| E01028435 | Cherwell 004A | Banbury Grimsbury | 6694 | 2 |
| E01028450 | Cherwell 005B | Banbury Ruscote | 4654 | 2 |
| E01028454 | Cherwell 005F | Banbury Ruscote | 5997 | 2 |
| E01028518 | Oxford 017B | Blackbird Leys | 3949 | 2 |
| E01028520 | Oxford 018A | Greater Leys | 5311 | 2 |
| E01028552 | Oxford 016A | Littlemore & Rose Hill | 6007 | 2 |
| E01028577 | Oxford 016F | Littlemore & Rose Hill | 5365 | 2 |
| E01028692 | Vale of White Horse 008C | Abingdon South | 5979 | 2 |
| E01028809 | West Oxfordshire 009A | Witney West | 6103 | 2 |
The Oxford LSOAs are in Greater Leys (Oxford 018), Littlemore & Rose Hill (Oxford 016) and Blackbird Leys (Oxford 017). The Cherwell LSOAs are in Banbury Grimsbury (Cherwell 004) and Banbury Ruscote (Cherwell 005). The Vale of White Horse LSOA is in Abingdon South and the West Oxfordshire LSOA is in Witney West.
Comparatively, there are 185 LSOAs in Oxfordshire ranked in the two least deprived deciles. This is over 40% of LSOAs in the county.
Change compared to 2019
With the changes for LSOAs, it should be noted that some areas have been split into two/three or merged from two to one. The LSOA names and codes have changed highlighting that these areas should not be compared to their previous form. Therefore these LSOAs, of which there are 42, have not been included when comparing the change.
In 2025, 102 LSOAs decreased their IMD decile (meaning that their level of deprivation increased as 1 is the most deprived) and 109 increased their decile.
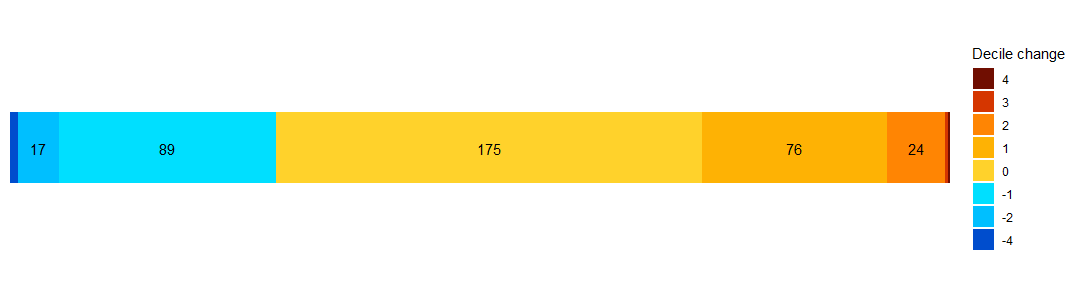
The LSOAs that decreased their decile by 3 or 4 to become more deprived were:
- Vale of White Horse 006G (Abingdon Town & West)
- Vale of White Horse 010F (Sutton Courtenay, Drayton & Steventon)
- Vale of White Horse 007D (Kingston Bagpuize & East Hanney)
- West Oxfordshire 002C (Kingham, Enstone & Middle Barton)
The LSOAs to increase their decile by 4 to become less deprived were:
- Oxford 008B (Oxford Central)
- Oxford 009D (Osney, Jericho & Port Meadow)
- Oxford 011C (East Central Oxford)
Notably, Oxford 008B increased from decile 2 in 2019 to decile 6 showing the decrease in deprivation in the area.
The following table shows the areas in 2019 that were in the most deprived two deciles and the change compared to their decile in 2025.
| LSOA Name | Parent MSOA Name | 2019 Decile | 2025 Decile | Decile change |
| Oxford 018B | Greater Leys | 1 | 1 | 0 |
| Cherwell 003D | Banbury Neithrop | 2 | 3 | -1 |
| Cherwell 004A | Banbury Grimsbury | 2 | 2 | 0 |
| Cherwell 004G | Banbury Grimsbury | 2 | 3 | -1 |
| Cherwell 005A | Banbury Ruscote | 2 | 3 | -1 |
| Cherwell 005B | Banbury Ruscote | 2 | 2 | 0 |
| Cherwell 005F | Banbury Ruscote | 2 | 2 | 0 |
| Oxford 005B | Barton | 2 | 3 | -1 |
| Oxford 008B | Oxford Central | 2 | 6 | -4 |
| Oxford 016A | Littlemore & Rose Hill | 2 | 2 | 0 |
| Oxford 016E | Littlemore & Rose Hill | 2 | 3 | -1 |
| Oxford 017A | Blackbird Leys | 2 | 3 | -1 |
| Oxford 017B | Blackbird Leys | 2 | 2 | 0 |
| Oxford 017D | Blackbird Leys | 2 | 3 | -1 |
| Oxford 018A | Greater Leys | 2 | 2 | 0 |
| Oxford 018C | Greater Leys | 2 | 1 | 1 |
| Vale of White Horse 008C | Abingdon South | 2 | 2 | 0 |
LSOA Oxfordshire IMD dataset: Oxfordshire_LSOA_IMD_2025
Oxfordshire
Overview
In 2025, the average rank of LSOAs in Oxfordshire was 9,477.60. The higher the number, the more deprived the area. This meant the local authority area was ranked 146 out of a total of 153 upper-tier local authorities in England. Conversely, the lower the rank, the more deprived the area.
The Oxfordshire average IMD score is 11.189 which ranks the area 144th in the country. Similarly, a rank of 1 indicates the most deprived area but a lower score here indicated a less deprived area.
Furthermore, 0.47% of LSOAs in Oxfordshire are in the most deprived decile in England. This equates to 2 LSOAs. 2.57% of the county’s population are living in the most deprived 30% of all areas.
This all shows that compared to other upper-tier local authorities in England, in 2025 Oxfordshire is one of the least deprived.
Change compared to 2019
In 2019 there were 151 upper-tier local authorities in England and Oxfordshire’s rank of the average rank was 142. Compared to the 2019 rank of the average rank, the local authority area has moved 4 places indicating that it is less deprived, however there were 2 more upper-tier local authorities in 2025 compared to 2019 so the change in ranking is very slight.
Whilst the change in rank of average rank of the local authority is a useful indication of how the area has changed, the IMD score provides better insight when comparing across years as this is not affected by the total number of local authorities changing.
| Year | Average Score | Average score rank (out of 153) | % LSOAs in the most deprived decile | Number of LSOAs in the most deprived decile | Extent |
| 2015 | 11.513 | 142 | 0.49% | 2 | 3.50% |
| 2019 | 11.656 | 142 | 0.25% | 1 | 3.92% |
| 2025 | 11.189 | 144 | 0.47% | 2 | 2.57% |
The table above shows that the county is consistently ranked as one of the least deprived areas in England and the deprivation score has decreased over the last 10 years. This indicates that deprivation in Oxfordshire is falling, albeit at a slow rate.
Falling deprivation is further illustrated by the “extent” decreasing. This is a measure of the proportion of an area’s population living in the most deprived 30% of all areas. In 2015, this was 3.50%, rising to 3.92% in 2019 but falling considerably to 2.57% in 2025.
Despite the proportion of Oxfordshire’s LSOAs in the most deprived 10% increasing since 2019, the sharp decrease in the extent may indicate that the gap between most deprived and least deprived in Oxfordshire is closing.
Headline data for Oxfordshire 2015-2019: Oxfordshire IMD 2015-2019
Districts
Overview
In 2025 there are a total of 296 lower-tier local authority districts (LADs). In Oxfordshire, there are 5 which are:
- Cherwell
- Oxford
- South Oxfordshire
- Vale of White Horse
- West Oxfordshire
The following table shows the average rank of LSOAs in each LAD. In this table, the higher the average rank, the more deprived the area. As can be seen, Oxford has the highest average rank of the LADs followed by Cherwell.
| Local Authority District name | Average rank | Rank of average rank | Number of LSOAs in decile 1 or 2 | Extent | Rank of extent |
| Cherwell | 10,938.34 | 243 | 3 | 3.00% | 225 |
| Oxford | 12,110.23 | 217 | 6 | 7.60% | 170 |
| South Oxfordshire | 7,046.39 | 287 | 0 | 0.00% | 282 |
| Vale of White Horse | 8,049.80 | 280 | 1 | 0.62% | 268 |
| West Oxfordshire | 8,641.18 | 270 | 1 | 0.68% | 265 |
The extent measure highlights the gap between the districts. A reminder that the extent is the proportion of a LAD’s population living in the most deprived 30% of LSOAs in the country.
This shows that 7.6% of the population in Oxford is in the most deprived 30% of the country. When compared to South Oxfordshire which has 0%, the deprivation disparity is stark.
Change compared to 2019
In 2019, there were 317 LADs in England compared to 296 in 2025. The following table shows the change in the rank of the average rank of each district. The average rank is a population weighted average of the combined ranks for the LSOAs in the district.
| District | 2019 average rank* | 2019 rank of average rank** | 2025 average rank | 2025 rank of average rank | Change in average rank |
|
Cherwell
|
11,879.57
|
220
|
10,938.34 | 243 | -941.23 |
|
Oxford
|
13,634.79
|
189
|
12,110.23 | 217 | -1,524.56 |
|
South Oxfordshire
|
6,409.95
|
302
|
7,046.39 | 287 | +636.44 |
|
Vale of White Horse
|
6,253.32
|
305
|
8,049.80 | 280 | +1,796.48 |
|
West Oxfordshire
|
6,502.07
|
301
|
8,641.18 | 270 | +2,139.11 |
*The higher the average rank the more deprived the area. **The higher the rank of average rank, the less deprived the area.
The decrease of the average rank of each of Cherwell and Oxford shows that they have become less deprived as areas. The increase in the other three districts shows the converse.