The recent Census 2021 ethnic group release is able to give us a detailed insight into the ethnicities found within the county.
Since 1991, the Census for England and Wales has included a question about ethnic group.
The ethnic group question has two stages. Firstly, a person identifies through one of the following five high-level ethnic groups:
- Asian, Asian British, Asian Welsh
- Black, Black British, Black Welsh, Caribbean or African
- Mixed or Multiple
- White
- Other ethnic group
Secondly, a person identifies through one of the 19 available response options, which include categories with write-in response options.
National information can be found on the Census 2021 bulletin and the datasets can be found on the Oxfordshire data explorer’s ethnicity section
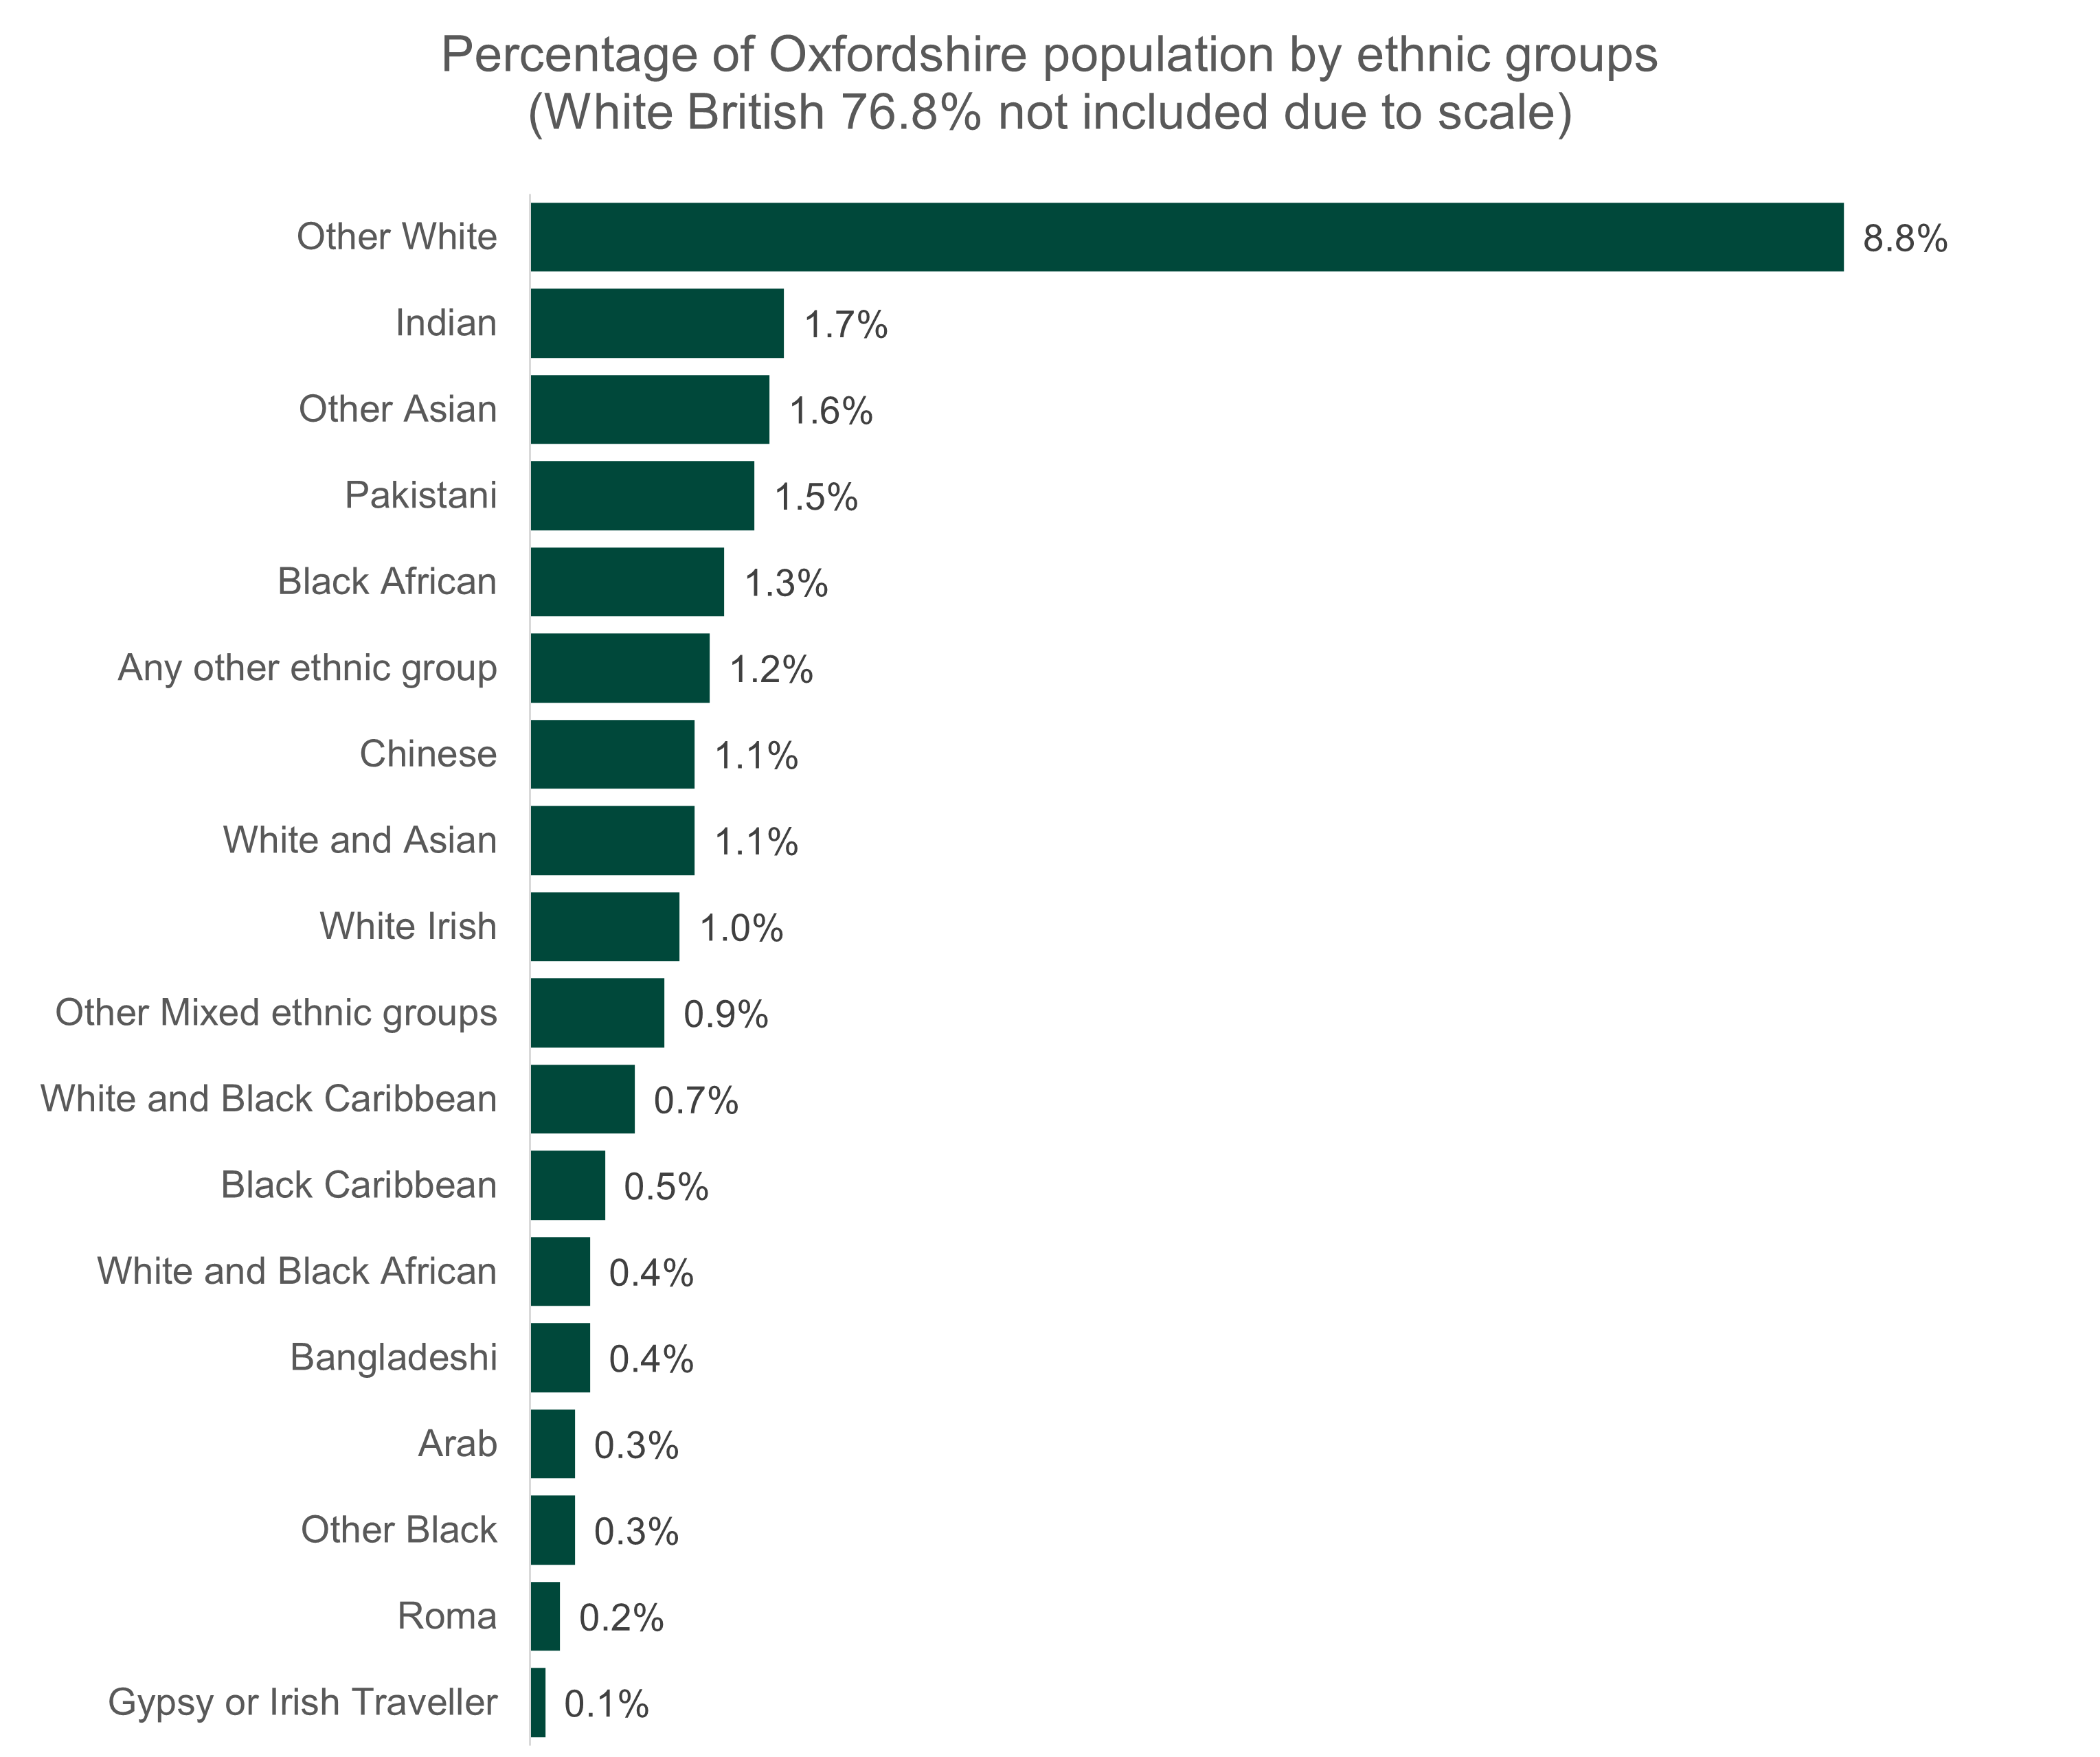
Non-White British ethnic groups in Oxfordshire
The largest ethnic group in the county is White: English, Welsh, Scottish, Northern Irish or British (76.8%).
Of those ethnic groups which are not White British, the largest in the county are:
- White Other (8.8%)
- Indian or British Indian (1.7%)
- Other Asian (1.6%)
- Pakistani or British Pakistani (1.5%)
- Black African (1.3%)
Ethnic groups which are not White British by district
| Area | Non-white British percentage |
|---|---|
| Cherwell | 22.1% |
| Oxford | 46.5% |
| South Oxfordshire | 14.2% |
| Vale of White Horse | 16.8% |
| West Oxfordshire | 11.0% |
| Oxfordshire | 23.2% |
| England and Wales | 25.6% |