Quick Ward Profiles
On the home page you’ll find the Quick Ward Profile Tool. It is a summary across all the data themes on the Oxfordshire Data Hub at electoral ward level. Use it when you want a summary of a particular ward.
On the map scroll to the place you are interested in, click in the ward boundary and a summary about the profile will load.
You can also search by postcode.
Data Explorer
Select Data Explorer from the Tools menu. Use it when you want to search for a specific data, including data that isn’t available in the standard profiles and reports. Using the Data Explorer, you can search all 15,000 + indicators, then view the raw data or visualise it in a variety of ways including on a map, in a graph or on a time series.
To find a dataset you have two options. The first is to browse through datasets on the ’Data ‘Explorer’ tool and use the ‘filter’ tool to narrow down the datasets that are visible on the list. The other option is to use the search function to specify with keywords what you are looking for. Both of these options are available to use at the top of the page.
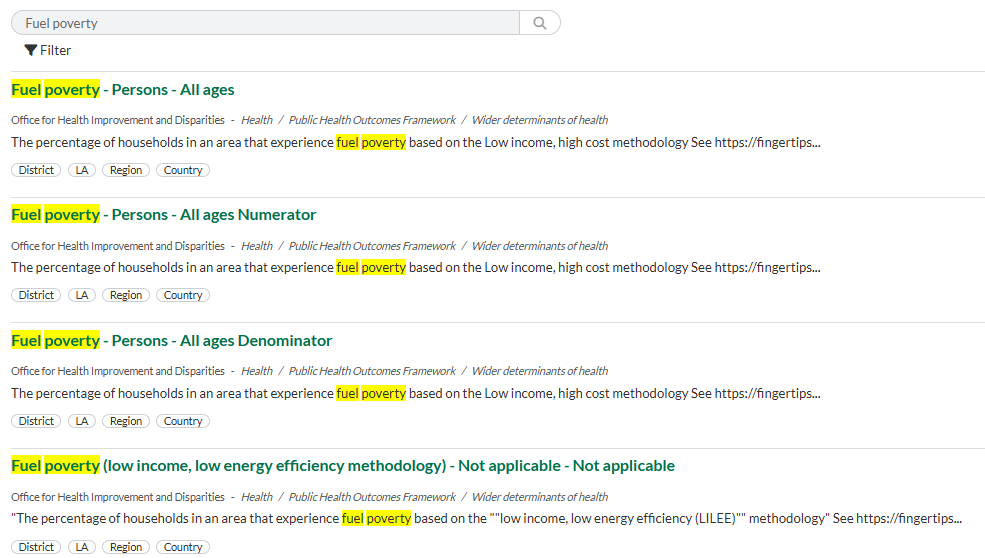
Search
The search function is self-explanatory and useful if you know what you are looking for. The function will use the keywords entered to search through the dataset title, and the summary or metadata description.
Filter
Within the ‘filter’ option there are three main fields which you can filter. These are, ‘Theme’, ‘Geography’ and ‘Publisher’. Expand by clicking the triangles, to see the list to select from in each option.
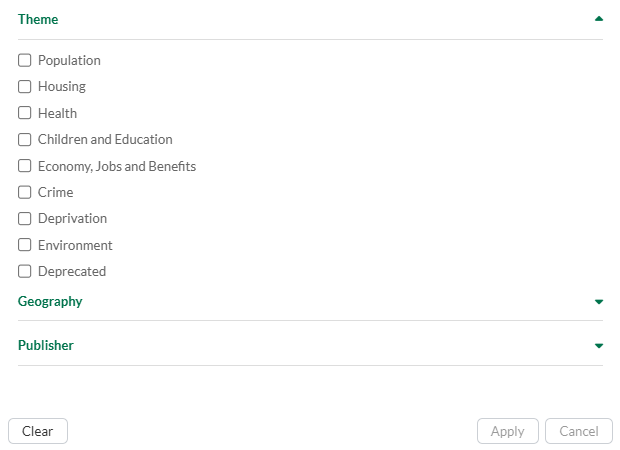
All datasets have been given a theme. Filtering by geography will show datasets that display the data by the chosen geography. For example, selecting LSOA will show all datasets where the data is broken down by LSOA. Some data is not exclusively LSOA data, a dataset may contain multiple geographic breakdowns, e.g. LSOA, MSOA, District. Filtering by ‘Publisher’ will show all datasets from the chosen publisher only. Some publishers have multiple names e.g. ONS and Office for National Statistics, so it is worth checking.
Custom area reporter
This tool allows you to make data reports over a custom selected area over a variety of themes. This allows you to chose the place you want a report for. Go to the Tools menu on the main menu bar and select Custom Area Reporter. It opens with the instructions for selecting an area in the right hand pane. It has the data selection in a bar in the top right with a drop down for different LSOA years or ward.
Use the drawing tools on the map to select an area. This can be by selecting the smallest geographies in turn by using the pointer tool, or by using a rectangle, circle or polygon drawing tool.
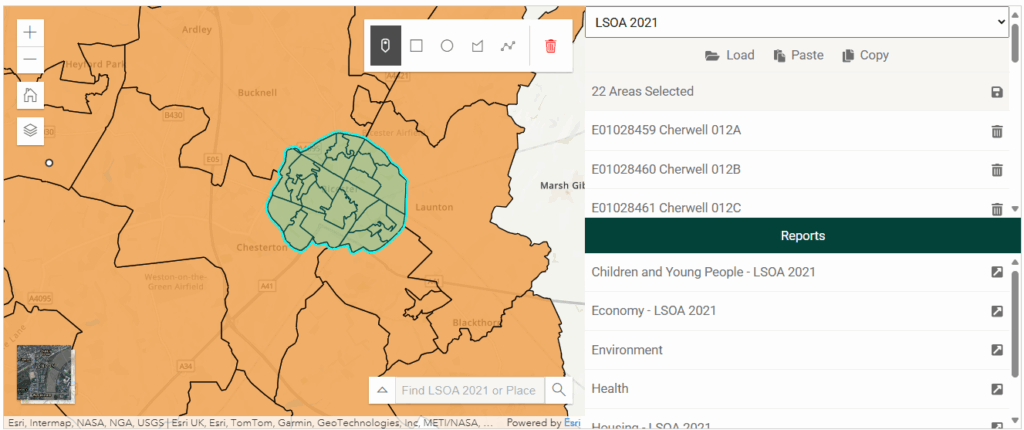
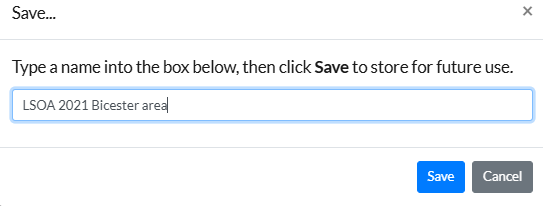
Clicking on the pointer tool allows you to move around the map and to select the home button to zoom back out. On the first row it tells you how many areas are selected and has a save button if you want to go back to the same area. The search bar at the bottom can be used to find a specific place.
A list of reports appear in the right pane, for speed of loading each of the themes is shown on a separate line. e.g. Health, Economy LSOA2021, Environment click on each in turn and they open in a separate page. Each map, chart or graph has a source at the bottom with options for extracting the image or data as a csv file. Each report may also be printed to PDF. The reports show the selected area results with some data indicators compared with Oxfordshire and England.